NOTICE: This trading system is no longer being updated due to contractual obligations. Thank you.
Note: Use the navigation panel on the top of this page to go to other pages.
Market: NSE (India)
Instrument: Stocks
Maximum number of positions: 10
Maximum time a position is held open: 15 days
Trades for next day are available after 6:00 PM (18:00 Hrs) Indian Standard Time
This trading strategy was developed to take advantage of short-term volatility of stocks and market in general. At any one time, the strategy will hold a maximum of 10 stocks and no more. Hence, only 10% of your portfolio is invested in each stock. Generated orders are placed on or before the market open the next day. All “BUY” orders are placed at “LIMIT PRICE” and all “SELL” orders are placed at “MARKET PRICE”. All orders irrespective of “BUY” or “SELL” are placed for “DAY” only i.e. if the orders are not executed by the end of the market close then those orders should be cancelled.
The strategy analyses all stocks that constitute the NIFTY and NIFTY-JNR indexes and determines the best trades each day. On average around 200 -220 trades are executed per year. I usually make sure that the total cost (i.e. brokerage, commissions and transaction charges) remain below 2-3% of my portfolio capital. By using a low-cost broker like Interactive Brokers, I have tried to keep the cost down and based on this criteria, I would assign a minimum of ₹. 6,50,000 as my trading capital. If you use a high-cost broker then you would have to adjust your trading capital relative to the costs involved. Trading cost is the most tricky bit of trading, if you don’t allocate capital relative to your costs then you can be rest assured that you are going to make a loss.
Now, I will present some performance results for my strategy. My initial trading capital when I started trading with this strategy was ₹. 10,00,000. Below is the equity curve from my account, trading from 2007 till today. The total return is a profit of 256%, returning on average 18.5% profit every year for the last 7 years.
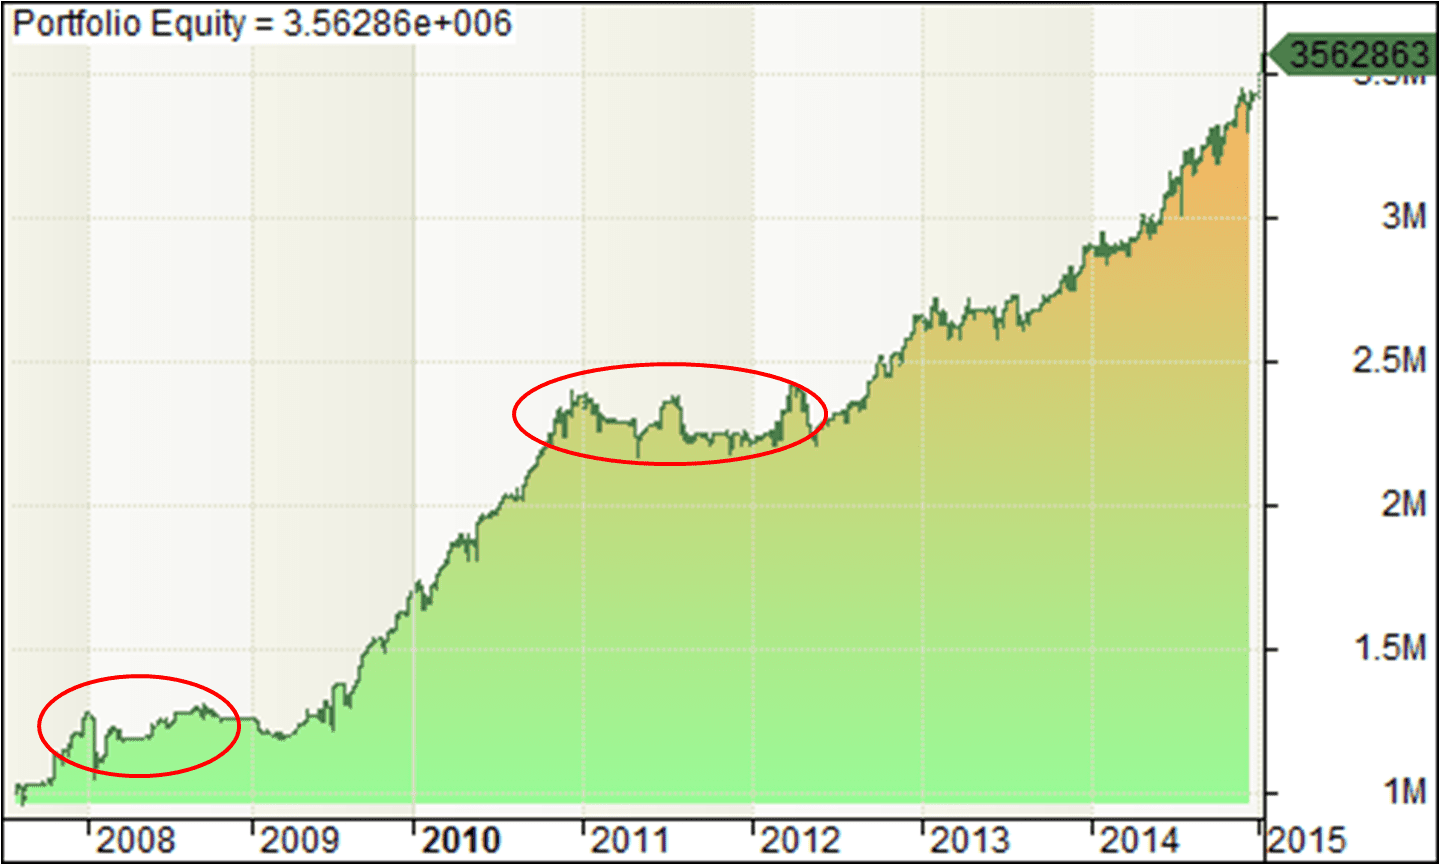
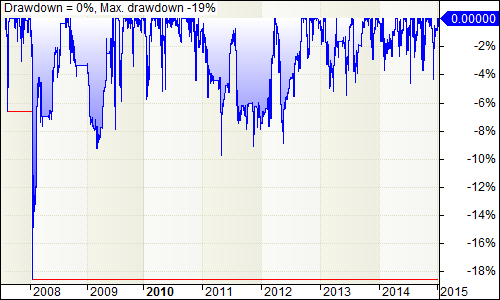
As you can see(red circles), during GFC circa 2008-2009 the strategy made losses but was able to recover. Then during 2011-2012 the strategy was neither making profit nor loss, it was almost flat! This shows that during drastic market downturn, the strategy quickly tries to minimize loss and maintain a flat equity curve. Below is the drawdown graph. The drawdown again clearly shows that during 2008 (GFC) the portfolio was experiencing 20% loss! And the strategy made amendments to quickly take action to minimize losses. During 2011-2012, although there was no drastic market downturn, the market was behaving very erratically with every trade making a loss. As the downturn was not sudden, the strategy took some time to adjust to the new market conditions and then corrected itself.
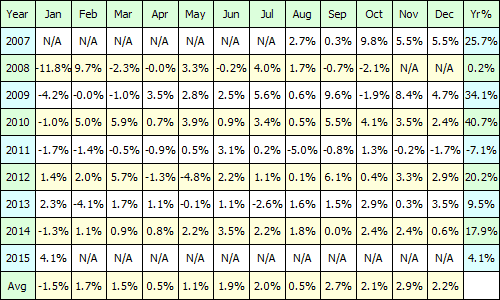
Below is month-by-month and yearly break down of profit/loss:
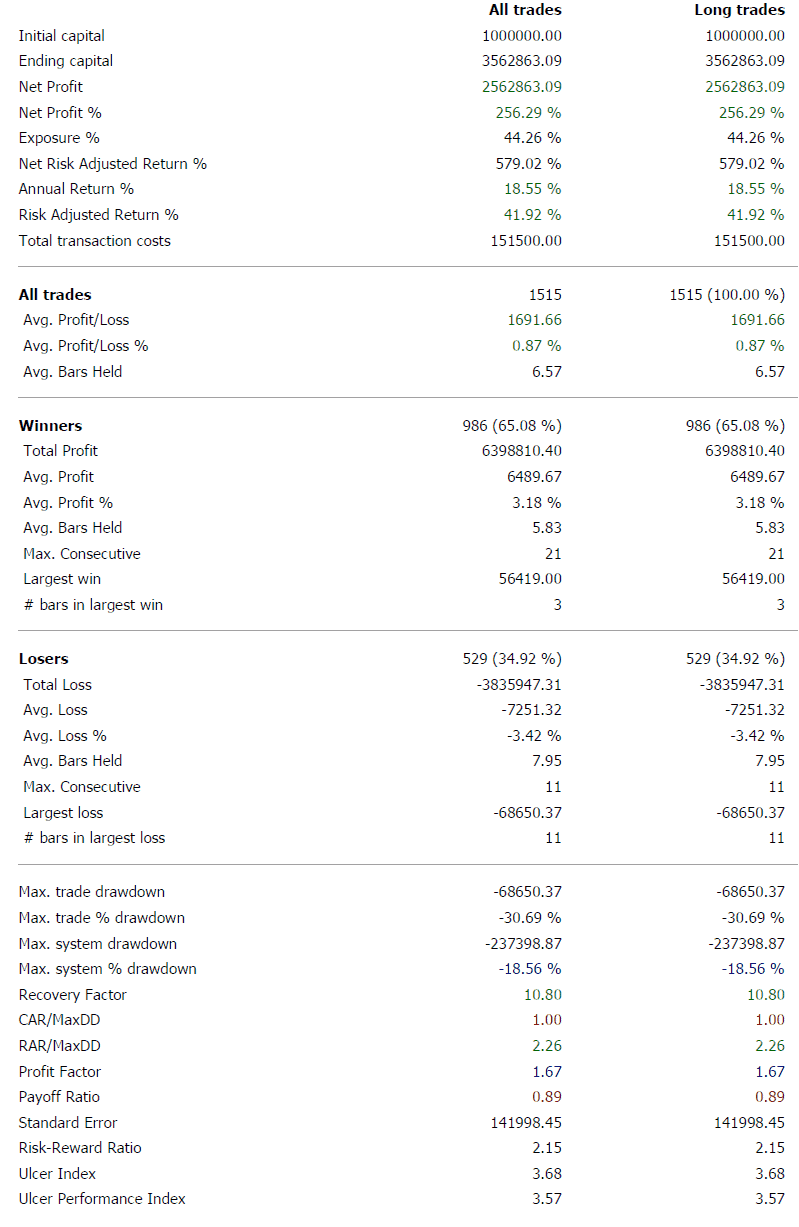
Below I present some performance statistics of this strategy:
Please visit Trading Area to download today’s trades and the entire trading history.
Please feel free to send an email with your comments and questions using the contact page.